Some time ago I wrote about micro benchmarking libraries for C++ - here’s the link. I’ve described three libraries: Nonius, Hayai, Celero. But actually, I wanted to cover fourth one. Google Benchmark library was at that time not available for my Windows environment, so I couldn’t test it. Fortunately, under the original post I got a comment saying that the library is now ready for Visual Studio!
Around one and a half year ago I did some benchmarks on updating objects allocated in a continuous memory block vs allocated individually as pointers on the heap: Vector of Objects vs Vector of Pointers. The benchmarks was solely done from scratch and they’ve used only Windows High Performance Timer for measurement.
After I finished my last post about a performance timer, I got a comment suggesting other libraries - much more powerful than my simple solution. Let’s see what can be found in the area of benchmarking libraries.
Intro The timer I’ve introduced recently is easy to use, but also returns just the basic information: elapsed time for an execution of some code… what if we need more advanced data and more structured approach of doing benchmarks in the system?
When you’re doing a code profiling session it’s great to have advanced and easy to use tools. But what if we want to do some simple test/benchmark? Maybe a custom code would do the job?
Let’s have a look at simple performance timer for C++ apps.
Intro A task might sound simple: detect what part of the code in the ABC module takes most of the time to execute.
In part 2 of the article about persistent mapped buffers I share results from the demo app.
I’ve compared single, double and triple buffering approach for persistent mapped buffers. Additionally there is a comparison for standard methods: glBuffer*Data and glMapBuffer.
Note:
This post is a second part of the article about Persistent Mapped Buffers,
It seems that it’s not easy to efficiently move data from CPU to GPU. Especially, if we like to do it often - like every frame, for example. Fortunately, OpenGL (since version 4.4) gives us a new technique to fight this problem. It’s called persistent mapped buffers that comes from the ARB_buffer_storage extension.
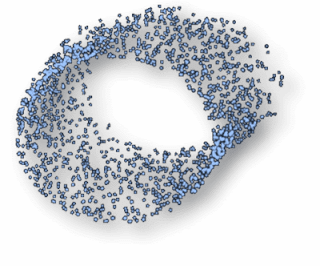
It’s time to start improving the particle code and push more pixels to the screen! So far, the system is capable to animate and do some basic rendering with OpenGL. I’ve shown you even some nice pictures and movies… but how many particles can it hold? What is the performance?
As I wrote in the Introduction to the particle series, I’ve got only a simple particle renderer. It uses position and color data with one attached texture. In this article you will find the renderer description and what problems we have with our current implementation.
The Series Initial Particle Demo Introduction Particle Container 1 - problems Particle Container 2 - implementation Generators & Emitters Updaters Renderer (this post) Introduction to Optimization Tools Optimizations Code Optimizations Renderer Optimizations Summary Introduction The gist is located here: fenbf / ParticleRenderer
In one of my previous post I wrote about performance differences between using vector<Obj> and vector<shared_ptr<Obj>>. Somehow I knew that the post is a bit unfinished and need some more investigation.
This time I will try to explain memory access patterns used in my code and why performance is lost in some parts.
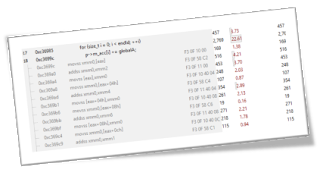
After watching some of the talks from Build 2014 - especially “Modern C++: What You Need to Know” and some talks from Eric Brumer I started thinking about writing my own test case. Basically I’ve created simple code that compares vector<Obj> vs vector<shared_ptr<Obj>> The first results are quite interesting so I thought it is worth to describe this on the blog.
One of the most crucial part of a particle system is the container for all particles. It has to hold all the data that describe particles, it should be easy to extend and fast enough. In this post I will write about choices, problems and possible solutions for such container.
Just a quick summary of a great presentation from Build 2014 called Native Code Performance on Modern CPUs: A Changing Landscape.
The presenter Eric Brumer (from Visual C++ Compiler Team) talked, in quite unique way, about deep down details of code optimizations. Why it is better to use compiler to do the hard work.